Multiperspective System Architecture Diagramming
Welcome. This guide is designed for engineers of all kinds who want to use multiperspective diagrams to document and share how their systems work.
What are multiperspective diagrams?
Multiperspective diagrams are diagrams that have multiple perspectives of the same resources. The resources (boxes) are defined in a model independent from these perspectives. The diagram author then uses the resources in the model to create perspectives. These perspectives visually show how the resources are related and interact in different ways.
Multiperspective diagrams have many advantages over traditional, single-perspective diagrams:
– Clarity. By breaking up diagrams into perspectives, diagram authors can bring much more clarity to a system. Individual concerns can be spread out over many perspectives, allowing each the space it needs without interfering with others.
– Extensibility. Multiperspective diagrams share a model, so creating additional perspectives from an existing diagram is incredibly easy, far easier than starting from scratch each time.
– Maintainability. A corollary to the above, individual perspectives can be modified without affecting the others. Diagrams that are easy to maintain get maintained, while diagrams that aren’t fall out of date quickly. Multiperspective diagrams greatly help in the fight to keep documentation up-to-date.
Tools
Multiperspective diagrams require a few conceptual tools:
– A model. You will build a tree-based resource model of your system in Part I below.
– Relational (box-and-line) diagrams. These will be used to show static relations between the resources in your model. You’ll build relational perspectives in Part II.
– Sequence diagrams. These will be used to show dynamic interactions between the resources in your model. You’ll build sequence perspectives in Part III.
Multiperspective diagrams can be created by hand, or using general-purpose diagramming tools such as Diagrams. However, to get the full benefits of multiperspective diagrams, and to create them easily, use a diagramming tool that has first-class support for models and perspectives. Ilograph and Structurizr are two such tools.
One note before beginning: while the examples in this guide are all drawn from cloud computing, multiperspective diagrams can be created for any domain.
Part I
Building a Model (or: Answering “What is There?”)
“What is there?” is a simple but important question when diagramming a system. It is tempting to ignore it, to say to yourself “it is obvious!” and jump right into drawing boxes and lines. This is a mistake. Taking time to answer it, to build a model of the resources in your system, is the critical first step to multiperspective diagramming.
The model you build will be the foundation for your multiperspective diagram. It will serve the same role as a schema for a database or classes and functions for a software program. Your model will keep your perspectives aligned, and, if using the right tools, greatly reduce the time it takes to create (and maintain) perspectives.
Step 1: Write down your resources
Start by writing down all the nouns you can think of in your system. Don’t think about how these things are related or interact (this will come later). Also, don’t worry if they’re big or small (e.g. a single database table vs. a service), or what types they are (e.g. functions, queues, roles). If it’s a noun, write it down.
Write down the name of the thing. Don’t worry yet if there are duplicate nouns with the same name (e.g. two tables from different databases named Customers); you will account for that later.
Try putting 10 minutes on a timer and challenging yourself to write down as many of these nouns as you can. Even better, get another person familiar with the system to independently do the same and compare your results. You might be surprised at how many you come up with (and, if you are comparing with someone else, how many you miss).
Once done, you should have a jumbled list of the resources in your system. It is a far cry from a diagram, but it’s a promising start. The next step is relatively simple: write down the type of each resource next to its name.
Step 2: Add types
For example if your list looks like this:
GetItems
CreateItem
Permissions
AppBuild
Items
Artifacts
...
Add types like so:
GetItems - Lambda function
CreateItem - Lambda function
Permissions - DynamoDB table
AppBuild - Codebuild project
Items - REST resource
Artifacts - S3 bucket
...
Resource types are a critical part of any model. Without a type, a viewer would know the name of the resources in a diagram, without knowing what they actually are.
In a diagram, a resource’s type is usually expressed as text, an icon, a color, or some combination of the three. How this is actually rendered in the diagram is tool-dependent. For now, simply write the resource’s type next to its name.
After two steps, your model identifies the scale of the system (knowable just by looking at how long the list is), and all of its resources by name and type. It’s not a diagram yet, but it still would be (modestly) informative to someone new to the system.
Even with both a name and a type, your resources are still a jumble, and may not even all be unique (for example, by having two database tables named Customers). The third step addresses this, and adds some welcome structure to your model.
Step 3: Create a resource tree
In the third step you will convert your resource list into a resource tree. For each resource, decide if it is a component of another resource on your list (that is, having a strict parent:child relationship). If resource A cannot exist independently of resource B, then their relationship is one of composition. A database (parent) and a table in that database (child) is a good example of composition; the table cannot exist independently of the database. A team (parent) and player (child) is a good counterexample, since the player can exist independently of the team.
Once you’ve identified a strict parent:child relationship between two of your resources, move the child resource under and indented from its parent.
Once done for all resources in the list, you will have a complete resource tree similar to this:
- TechCompany AWS Instance - AWS account
  - Lambda - AWS service
    - GetItems - Lambda function
    - CreateItem - Lambda function
    - SetPermissions - Lambda function

  - DynamoDB
    - Permissions - DynamoDB table
    - Items - DynamoDB table

...
You will use this model of your system to create perspectives in the next section. Before moving on to that, here are some additional notes on composition:
How many parent:child relations should my model have?
Less than you might think, actually. Parent:child relations are useful (necessary, in fact) when you have resources with the same name in your model. Consider again the example where there are two database tables named Customers in two separate databases. Since they have the same name, the only way to differentiate them in your model is by their parent databases:
  - Alpha - Database
    - Customers - Table

  - Bravo - Database
    - Customers - Table
To reiterate, you should compose two objects if one cannot exist outside of the other. Table:Database and Room:Building are good examples. Other than strict compositions like these, however, you should declare parent:child relationships relatively sparingly in your model. Most models used for diagramming should be fairly flat.
(Optional) Step 4: Transfer your model to your diagramming software
If your diagramming software supports models (e.g. Ilograph or Structurizr), import your model into it now.
Part II
Adding relational perspectives
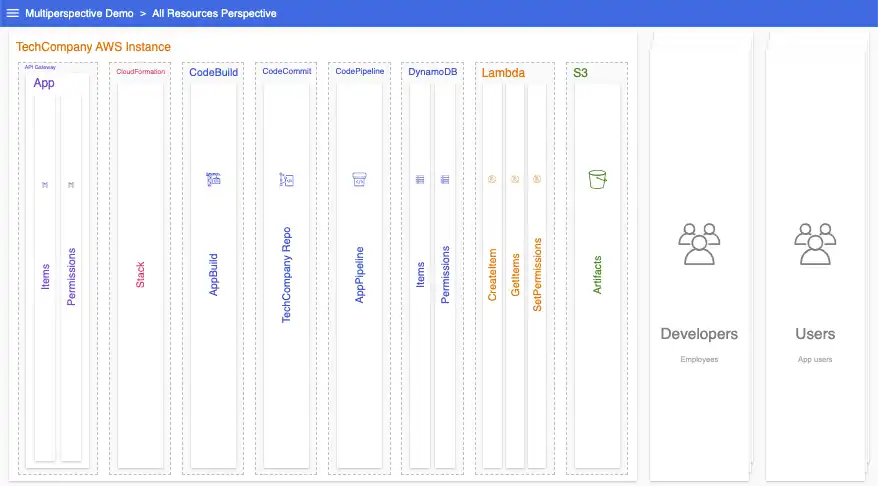
Now that you have your model, it’s time to create perspectives with it. This is best learned by example. In this section, we’ll create relational perspectives from a sample Ilograph model (rendered in the first image below) of a hypothetical serverless AWS solution. Relational perspectives, per their name, show various ways resources are related.
With your own model, try to create perspectives similar to the ones described here. Start as simply as you can, but don’t be afraid to experiment. You can always break up or combine perspectives later.
Our sample model already contains some relational information in the form of parent:child compositions. Here is what it looks like rendered only with these relations. All of the resources are displayed, with child resources drawn inside of their parent resources:
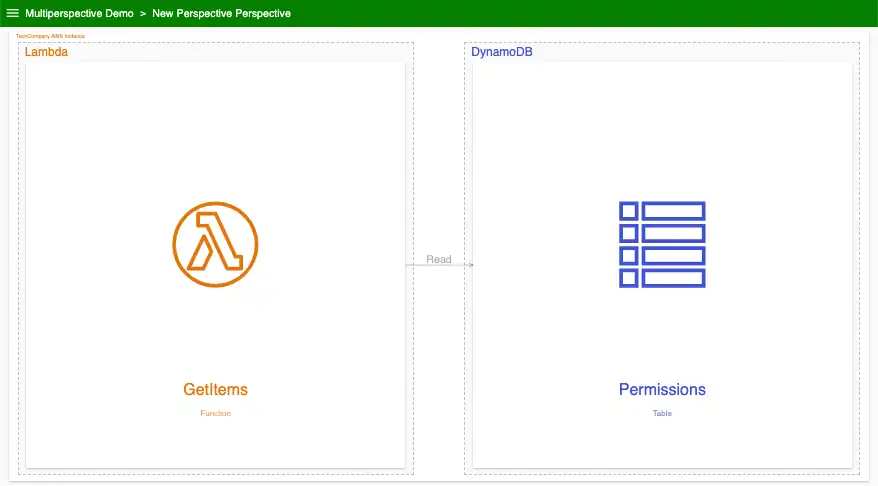
Next, let’s consider other relationships the resources in this model have. For instance, in this system, a Lambda function (GetItems) may read from a DynamoDB table (Permissions). Both the table and the function exist independently of each other, but there is a relationship there, one of dependency:
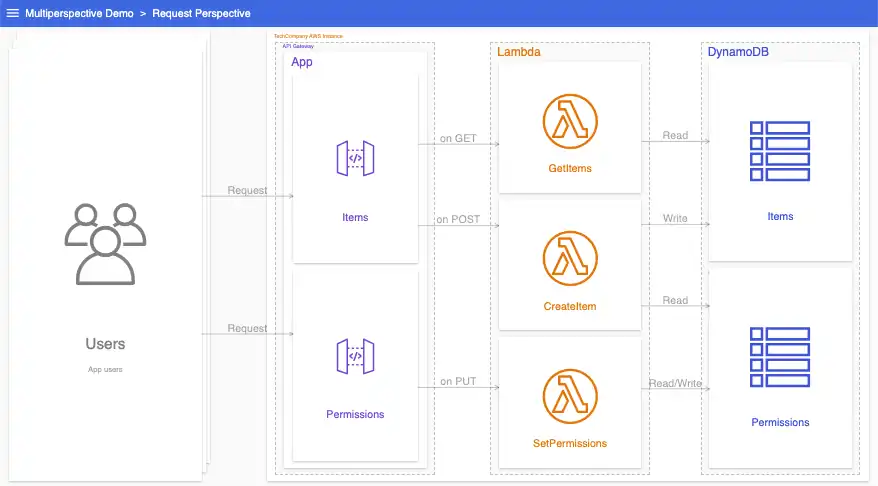
This system might have other, similar, dependencies; we’ll show those in this perspective as well:
This perspective now tells a cohesive story. It shows what API Gateway resources invoke what Lambda functions, and what tables those functions then read from and write to. We have our first perspective! It tells the viewer critical information about this system, but it isn’t the whole story.
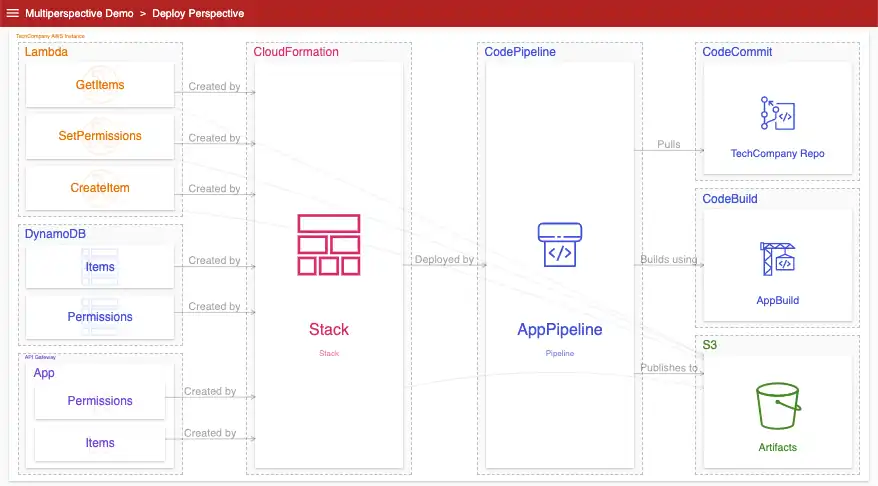
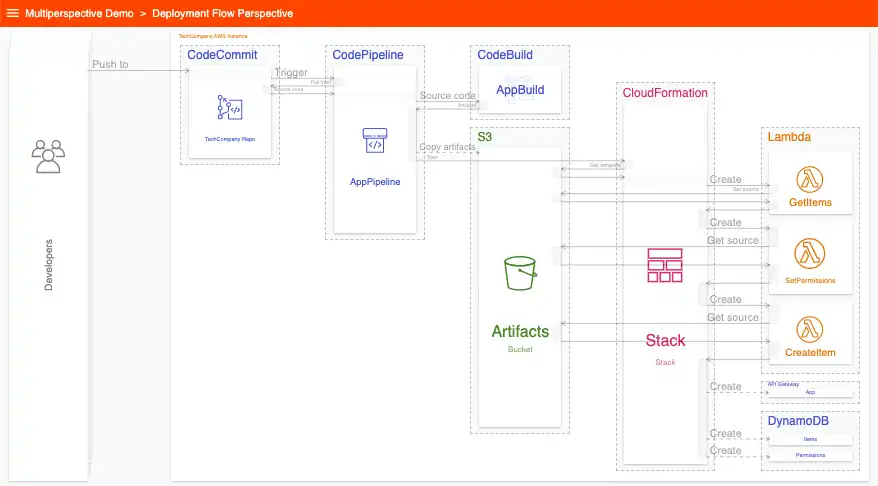
Above, we said this perspective shows dependencies. More specifically, this perspective shows run-time dependencies. What about deploy-time? How are these resources built, configured, and deployed? Traditional single-perspective diagrams often try to show those concerns in the same view. Invariably, the results are messy, uninformative, or both.
Instead, using a multiperspective approach, let’s separate out deploy-time dependencies into a different perspective:
This perspective has a mix of resources that appear in the above perspective, and new resources that do not. Viewers can now switch between these perspectives to compare run-time and deploy-time dependencies:
Run-time and deploy-time dependencies are two of many perspectives that can be created for our hypothetical system. Other examples include security, permissions, ownership, logging, and networking. When thinking about your own system, consider all the different kinds of relations your resources have, and show them using different perspectives. Many simple perspectives are preferable to a smaller number of complicated perspectives.
Part III
Adding sequence perspectives
The perspectives we created in the previous sections are relational; they show us how resources are related in two contexts (run-time and deploy-time). For example, the deploy-time perspective tells the viewer that AppPipeline writes files to Artifacts (the S3 bucket) while GetItems (the Lambda function) gets its source from Artifacts.
This perspective does not tell the viewer much about the deploy-time interactions between these resources, however. Experienced viewers may be able to infer the operations, and their order, between the various resources when the solution is deployed. That said, we want our diagrams to deliver as much clarity as possible, so let’s create a new perspective to document this.
While relational perspectives are familiar box-and-line diagrams, sequence perspectives are sequence diagrams. They show specific interactions between resources, including operations and their order. You can learn more about sequence diagrams, and how relational and sequence diagrams complement each other, in this post.
Below is a new sequence perspective showing the deployment operations in full:
This perspective has all of the same resources as the relational deploy-time perspective. Read top-to-bottom, it shows all the operations that go into a deployment. Attempting to convey this information in a box-and-line diagram would have been difficult if not impossible.
As before, viewers can compare the two:
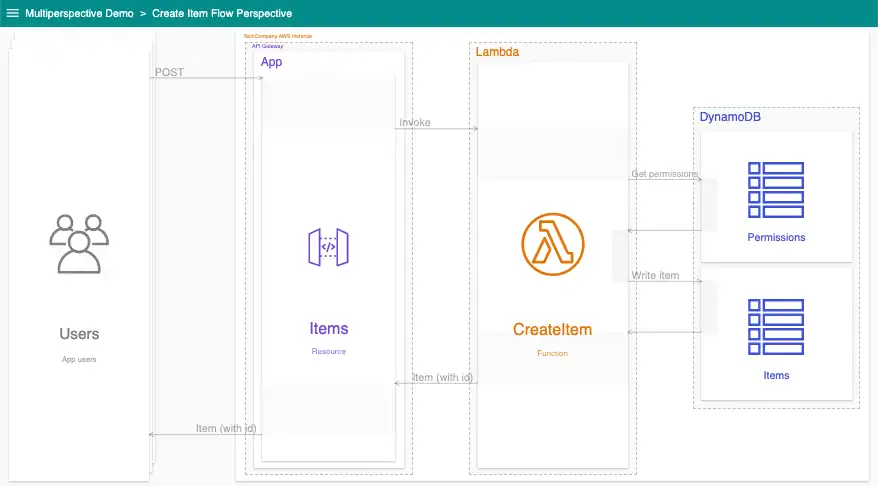
Sequence perspectives can also be created for run-time operations. Below is a new perspective showing how items are created and placed into the Items table. Similar perspectives could also be made for retrieving items and setting permissions.
You can create sequence perspectives for as many operations as your system has. There can be dozens, or even hundreds, in complex systems. When starting out, focus on the most critical, noteworthy, or value-driving operations that your system performs.
Addendum
While diagrams, multiperspective or not, are great tools for documenting a system, they can’t explain everything. Always be sure to add a description alongside every perspective you create to give viewers important context and motivations.
Click here to view the sample diagram used in Part II and Part III.
Questions or comments? Please reach out to me by email at billy@ilograph.com.
Share this article on Facebook
Share this article on LinkedIn


